Welcome to
www.raman.deFundamentals & Technology
of Raman Spectroscopy

Introduction

Fundamentals

Technology

Fundamentals & Technology
of Raman Spectroscopy
www.raman.de is a non-commercial website about Raman spectroscopy. Raman spectroscopy is based on the Raman effect which has been discovered by the Indian physicist Sir Chandrasekhara Venkata Raman in 1928. In 1930 Sir Raman received the Nobel price for this discovery.
Raman spectroscopy is a contact-free analytical technique for the chemical and physical characterization of biological, chemical, and pharmaceutical samples, semiconductors, gems, catalysts, minerals, polymers, and other materials. It gets more and more important due to recent developments in laser technology, more sensitive detectors, robust spectrometer optics, and, last but not least, through its easy use.
Raman spectra are unique fingerprints of solid, liquid or gaseous materials and might answer to the questions:
What is it? can be answered by comparing a sample spectrum with reference spectra or spectral libraries. Analyzing Raman
band intensities provide the answer to the question: How much?
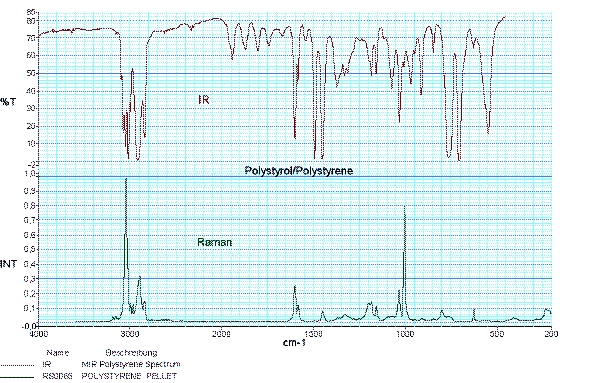
The Raman and the infrared (IR) spectrum of
the same material complement each other. Whether a band is observed in a Raman or in an IR spectrum and with
which intensity depends on selection rules.
Raman spectroscopy combines the advantages of infrared (IR) and near-IR (NIR) spectroscopy. Although Raman and infrared spectroscopy are based on different physical processes, both excite fundamental molecular vibrations and rotations. The analysis of NIR spectra is limited to specific analytical issues and needs often a time consuming method development. However, in the near infrared glass is transparent which reduces sample preparation and provides remote sampling by fiber probes.
| Raman Spectroscopy | Mid Infrared Spectroscopy | Near Infrared Spectroscopy | |
|---|---|---|---|
| Phenomenon | Scattering | Absorption | Absorption |
| Information | Fundamental vibrations (down to low wavenumbers) | Fundamental vibrations | Overtone and combination bands |
| Type of sample analyzed | Organics and Inorganics | Organics and Inorganics | Organics |
| Sample Preparation | No | Normally required | Seldom |
| Sample State | Solids and liquids | Solids, liquids, and gases | Mainly solids |
| Glass Vials | Yes | No | Yes |
| Water | Yes | Water has a strong spectrum | Yes |
| Remote Sampling | Yes | No | Yes |
Light which is inellastically scattered on molecules or crystal lattices is called Raman scattering due to the Indian physicist Chandrasekhara Venkata Raman.
Spectral analysis of light which was scattered on molecules or crystal lattices shows an intense spectral line matching the wavelength of the monochromatic light source (Rayleigh scattering) and much weaker lines at wavelengths which are shifted from the wavelength of the light source (Raman scattering).
The interaction between matter and light can be interpreted as a collision between a vibrating molecule or lattice and an incident photon. There are three possibilities:
The inelastic collision between a photon and a molecule is known as the Raman effect. The energy difference between the inelastic scattered photons and the incident photons is exactly the difference between two energy levels of a molecular vibration.
Energy-Level Diagrams of Raman Scattering and Rayleigh Scattering. N0, S0: Vibrational and Electronic Ground States. N1, S1: First Vibrational and Electronic Excited States. Dotted lines: Virtual States.
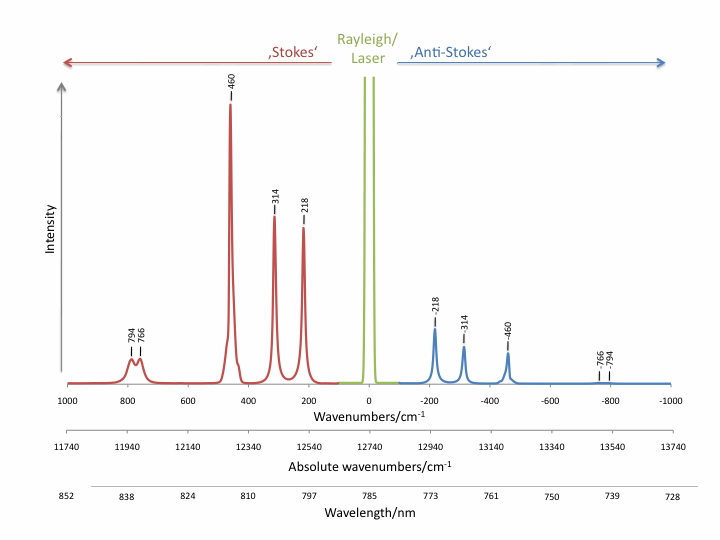
Raman scattering intensities are up to several orders of magnitudes lower than Rayleigh scattering, competing fluorescence and thermal emission. The intensity ratios of Stokes and anti-Stokes Raman bands are determined by Boltzmann’s law and can be used for the temperature measurement.
Raman scattering can easily be covered by competing processes which makes it difficult or impossible to be detected. Resonance Raman scattering (RR) or surface enhanced Raman scattering (SERS) can enhance Raman scatter intensities by several orders of magnitude.
Non-resonant Raman scattering intensities mainly depend on:
Stokes/Anti-Stokes. Bands shifted from the Rayleigh line to higher wavenumbers (blue shifted) are called anti-Stokes Raman bands. Bands shifted to lower wavenumbers (red shifted) are called Stokes Raman bands.
Raman spectroscopy and infrared spectroscopy provide a unique spectral fingerprint of a substance and complement each other. Using selection rules, it can be predicted whether a molecular vibration is Raman or infrared active.
As a consequence of the selection rules, infrared spectroscopy provides detailed information about functional groups and Raman spectroscopy especially contributes to the characterization of the carbon backbone of organic substances or polymers.
Infrared absorption can be detected if the dipole momentum µ in a molecule changes during the normal vibration. The intensity of an infrared absorption band IIR depends on the change of the dipole moment µ during this vibration:

where q is the normal coordinate.
A Raman active vibration can be detected if the polarizability α in a molecule changes during the normal vibration. The intensity of a Raman active band IRaman depends on the change of polarizability α during this vibration:
where q is the normal coordinate.
In general, molecular vibrations symmetric with regard to the centre of symmetry are forbidden in the infrared spectrum, whereas molecular vibrations which are antisymmetric to the centre of symmetry are forbidden in the Raman spectrum. This is known as the rule of mutual exclusion.
Selection Rules. Raman spectrum and infrared spectrum of a substance complement one another.
In Resonance Raman (RR) spectroscopy the wavelength of the exciting light source, typically a laser, coincides with the wavelength of an electronic transition of the sample. In this case, the Raman scattering intensities of totally symmetric vibrations of the molecular moiety involved in the electronic transition are enhanced by a factor of 102 to 106.
Components in low concentrations which can not be detected by normal Raman scattering become detectable due to resonance enhanced Raman scattering.
If the excitation wavelength matches the absorption of a specific part of the molecule, then the Raman spectrum associated with this part of the molecule is selectively enhanced and hence separated from the rest of the molecule.
A common characteristic of a non-resonant Raman spectrum is the absence of overtones and combination vibrations. In a resonance Raman spectrum numerous overtones can be observed.
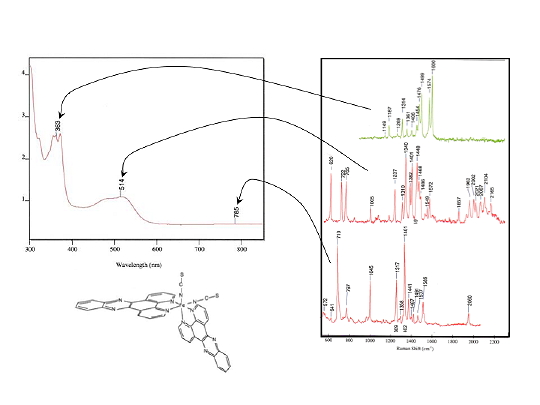
The different types of Resonance Raman Scattering
The UV/Vis absorption spectrum on the top left shows two major absorptions of the molecule. Exciting the Raman spectra at 363 nm and 514 nm results in resonantly enhanced Raman spectra which are associated with the metallo porphyrine ring (363 nm) and the highly conjugated part (514 nm) of the molecule. All parts of the molecule contribute to the non-resonant Raman spectrum excited at 785 nm.
The Raman scattering intensity of molecules which are absorbed onto a roughen metal surface can be amplified up to 106x - 108x. This effect is named Surface Enhanced Raman Scattering (SERS). SERS allows the detection of very low concentrations of analytes.
The strongest SERS enhancements are observed with gold, silver and copper. Roughness can be expressed as the diameter of a spherical shape. Typically, SERS needs sphere sizes about several nanometers, e.g. 40-300nm. SERS is a potential technique for the detection of single molecules.
Raman and Rayleigh scattering of molecules are substantially amplified if they are resonant with the radiation of a surface plasmon.
During the interaction of light and the molecule the Raman scattering enhancement is mediated by a surface plasmon. A surface plasmon is an oscillating electromagnetic field at a metal interface. It decays exponentially on both interface sides and its amplitude can be resonantly enhanced by radiation with a suitable wavelength.
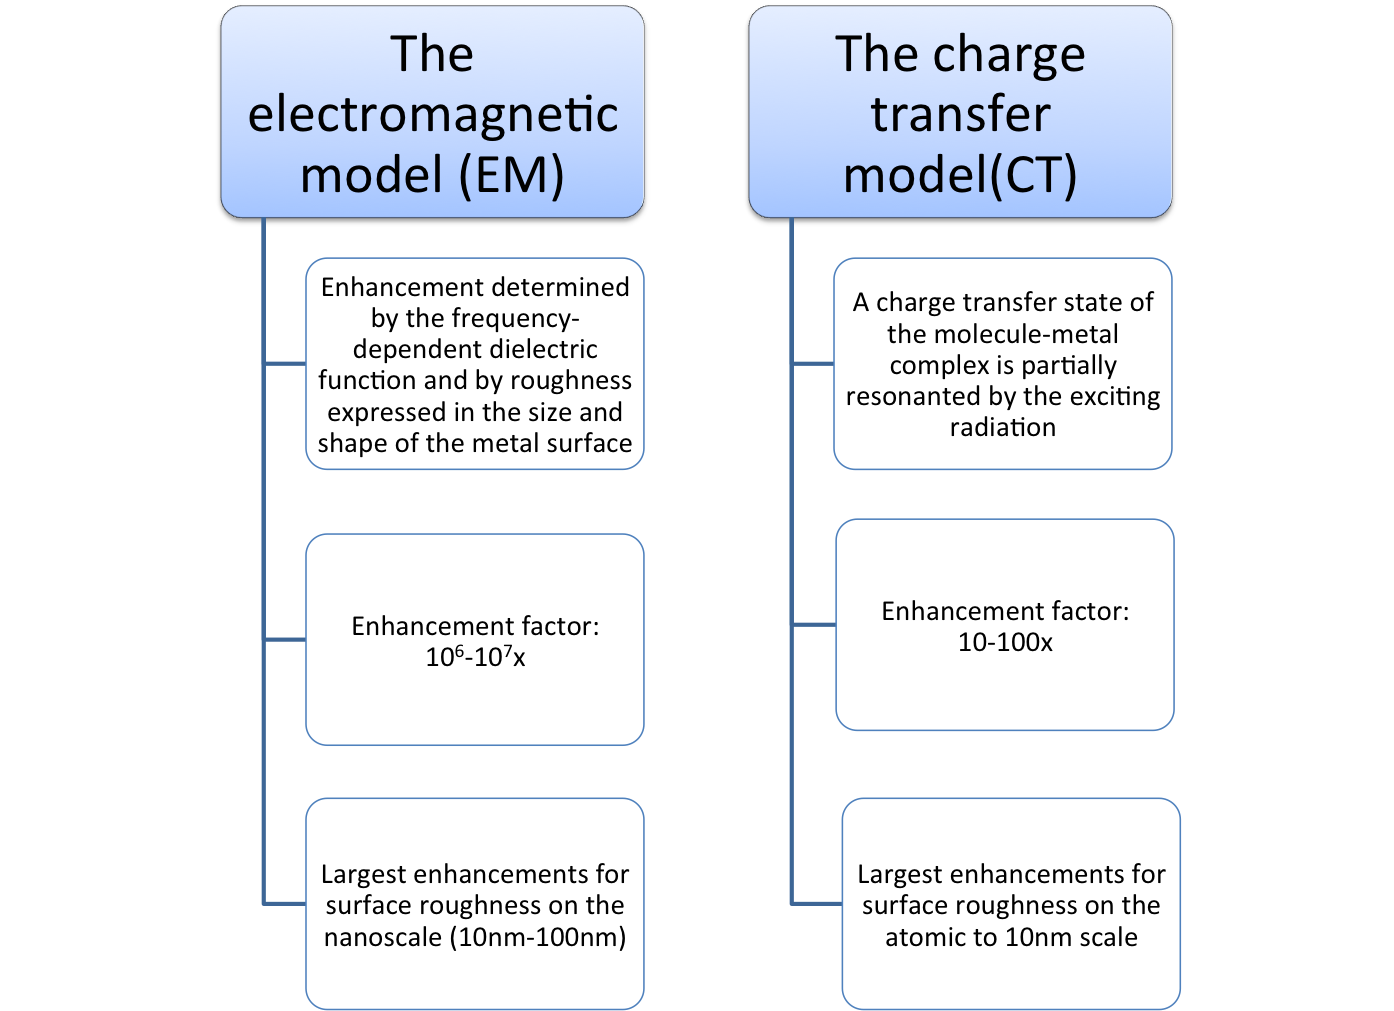
In the EM model largest enhancements occur with surfaces that are rough on the nanoscale (10nm – 100nm). The shape and size of the surface and the frequency-dependent dielectric function of the surface materials play very important roles in SERS. The enhancement is already mediated within close distances between the molecules and the metal surface. It does not require the direct contact of the molecules to the metal surface.
A charge transfer state is primarily involved between the surface complex of the absorbed molecule and a metal surface. In the CT model largest enhancements occur with surfaces that are rough on the atomic to 10nm scale.
Enhancement factors were observed that exceeds the factors that can be explained by the electromagnetic mechanism and the chemical mechanism. A special enhancement can be explained by as called electromagnetic hotspots.
In the EM model the enhancement is already mediated within close distances between the molecules and the metal surface. In the CT model a charge transfer state is primarily involved between the surface complex of the absorbed molecule and a metal surface.
A Raman spectrometer contains at least 4 units:
High sensitivity is obtained by using the intense light of a focused laser beam, a good collection efficiency for the Raman scattered light, high throughput optics and a sensitive detector unit. A computer controls the complete system and displays the Raman spectra or directly the result of a spectral analysis.
Raman spectra can be obtained by illuminating a sample with lasers emitting at almost any wavelength. The wavelength is chosen due to the availability of lasers and the required sensitivity for the analysis (the Raman scattering intensity is inversely proportional to 4th power of the excitation wavelength).
For a high sensitivity of the Raman spectrometer appropriate detectors have to be used. Silicon based CCD detectors typically are used for the UV and visible spectral range. In the NIR, Raman spectra are detected by Indium Gallium Arsenide (InGaAs) or Germanium (Ge) single point detectors.
The choice of the spectrometer type depends on the sample.
Usually, dispersive CCD/diode laser systems are preferred for dilute components of mixtures and solutions, weak scatterers and thermolabile samples.
NIR FT (Fourier Transformation) Raman systems offer a better wavelength accuracy, larger spectral range, higher resolution and generally they have an ultimately lower fluorescence interference, especially when excited at 1064 nm.
If the Raman effect is stimulated in the near infrared (NIR) most materials do not show fluorescence. However, Raman scattering intensities are strongly reduced due to NIR excitation and due to less sensitive detectors in NIR. Interferometer based spectrometers can partly compensate this loss by a higher throughput.
Laser beams can be focused to very small diameters down to the size of the diffraction limit of light. Highly focused energy of laser light onto micro samples results in high fluxes of Raman scattering. Thus, micro samples are ideal Raman samples.
For Raman spectroscopy of micro samples a laser perfectly illuminates the sample through an optical microscope. Utilizing a confocal microscope, only the back-scattered light of a diffraction limited volume is imaged into a Raman spectrometer. Core of a confocal microscope is either a pinhole or a slit that rejects back-scattered light, which is generated outside of the well-defined diffraction limited volume. Thus, confocal microscopes acquire Raman spectra only from a well-defined spatial volume.
Raman microscopy provides single spectra of small samples, but provides as well line scans along cross-sections of a sample. Distributions of single or multi components as 2D and 3D images can be derived from maps of their Raman spectra.
The diffraction limit of light is valid for far-field optics. This means that an optical detection system is located in a distance of at least multiple wavelengths from the sample. Near-field optics overcomes the diffraction limit of light. In this case the optical detection system is very close to the sample within the order of the wavelength of the light that is used for the illumination of the sample. Raman images with a spatial resolution of about 10 nm can be derived by combining near-field scanning optical microscopy (NSOM) and a Raman spectrometer.
If Raman scattering is excited close to an electronic transition, it sometimes coincides with fluorescence. Since fluorescence is typically several orders of magnitude stronger than Raman scattering, already fluorescent traces of impurities may avoid the detection of the Raman spectrum of the major material.
Selecting an excitation wavelength far away from any electronic transition of the sample generally avoids fluorescence. Fluorescence can be avoided most effectively by NIR FT Raman spectroscopy.
This method is appropriate for samples where fluorescence originates from impurities.
Irradiating the sample with intense light for a few minutes, preferably by the Raman laser, decomposes fluorescent species. This method is applicable for solid samples where fluorescence originates from impurities.
Spatial filtering by the pinhole of a confocal microscope reduces the detected fluorescence from outside of the laser focus and detects the Raman scatter within the laser focus. Applicable to relatively small intense fluorescent samples.
This method is applicable for low fluorescent samples. Two Raman spectra are collected subsequently at slightly different laser wavelengths. Subtracting the spectra from one another removes the unchanged fluorescence background. The Raman spectrum is reconstructed from the difference spectrum by a mathematical procedure.
Small intense fluorescent background is removed via a mathematical procedure. Typically applied for removing a remaining low-intense fluorescent background after photo-bleaching.
Raman scatter intensities are increased relatively to fluorescence by resonance Raman scattering (RR) and surface enhanced Raman scattering (SERS).